Blockchain Compensation Survey 2024
August 5th, 2025 | Nick Zurick

Key Findings
● Last year we saw 3% of people paid in crypto. This year we’ve seen a 3x jump to 9.6%.
-
– Stablecoins USDC & USDT are leading the charge with the majority of folks who take their salary in crypto receiving USDC
● Is crypto going back to the office? Probably not, but in office work is up 4x (to 6%).
● Looking at the median numbers, having an MBA does not equate to higher salaries in Web3. In fact, there’s a slight decline in compensation.
● By looking at median salaries, woman make more in Marketing, Operations, BD, but not in Engineering and Executive positions.
● Engineering Salaries across the board in seniority are on the rise! Most notably Jr & Mid-level roles have seen a large increase: 25.6% increase for Jr Engineers, 14.49% for Mid, 4.9% for Sr.
Methodology Overview
Our survey includes data pulled from dozens of geographically-distributed startups and information we gathered from hundreds of participants in the crypto community spanning a wide range of professions. The data reflect seed to later-stage companies across half a dozen different sectors, including DeFi, CeFi, gaming, and more.
For the purpose of this report, “Executive” refers to C-Suite leaders & Founders, “Engineering” refers to anyone in technical roles, and we used “Operations” as a ‘catch all’ for roles such as Customer Service, Chief of Staff, Strategy, etc.
The Pantera team has done our best to anonymize the data set. In certain instances, we had to exclude: significant outliers, incorrectly formatted submissions, and specific information that would identify certain projects. We normalized the data based on experience level, geography, company sector, job function, and other factors.
In the following report, where appropriate, we may combine data with our last survey from December 2023 in order to provide a more thorough analysis. All salary data is presented as median values denominated in USD, unless stated otherwise.
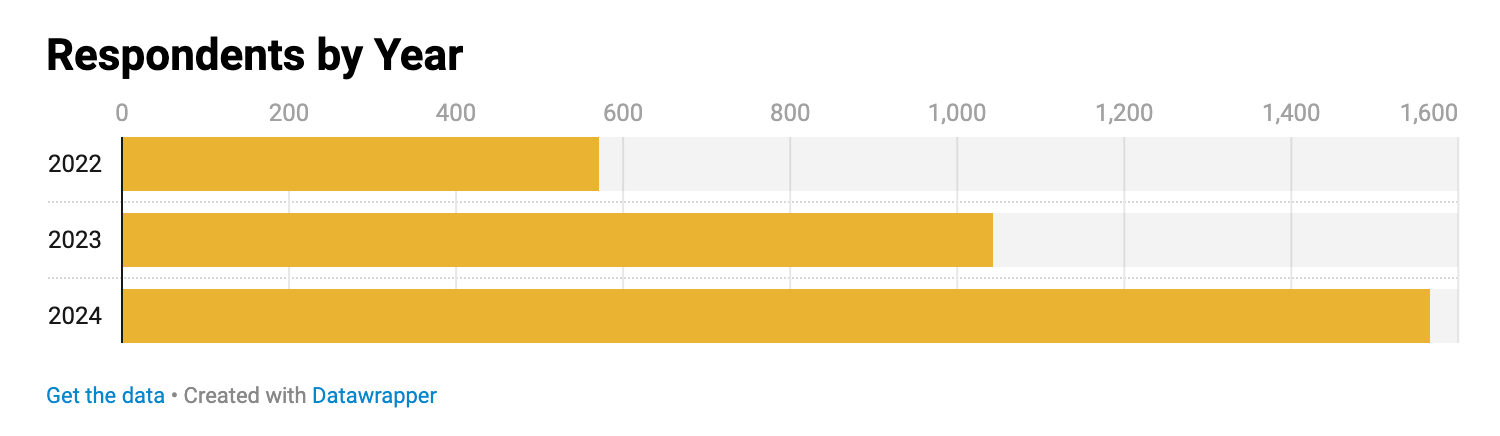
About the Respondents
Our data set contains over 1,600 responses of which 99% of respondents were professionals within the crypto community.
The data we have gathered spans 77 unique countries. With 72% of the data being international and the remaining 28% from the United States.
Our results skewed more toward the more experienced end of the spectrum with the majority of submissions being denoted as Sr. (i.e., with over six years of experience). Career level classifications for our survey are defined as: Early Career (1-3 YOE), Mid (3-6 YOE), Sr. (6+ YOE)
Classification by Function
Professional functions include Engineering, Operations, Marketing, Design, Business Development, Product Management, Executive Leadership, Finance & Accounting, Legal, and more.
By Sector
These professionals work across various sectors, which we’ve distilled down to DeFi, CeFi, Infrastructure, Consumer, NFT, and Gaming.
By Stage
The companies surveyed vary in size, ranging from teams with fewer than five employees to those with a hundred employees, spanning seed to growth stages. We broke down the respondents by stage below.
Around the World
Remote Work Trends (or Workplace Arrangements)
As part of our annual blockchain compensation survey, we gathered insights into workplace arrangements across the industry. Here’s a breakdown of work preferences and trends in 2024 compared to 2023.
● Is Crypto Returning to the Office? While the ecosystem remains predominantly remote, in-office work has seen a notable increase, quadrupling from 1.5% in 2023 to 6% in 2024. This signals a subtle but growing trend of organizations calling employees back to the office.
● Hybrid Work Remains Stable: The proportion of workers in hybrid arrangements remains largely unchanged, shifting only slightly from 10.6% in 2023 to 11% in 2024. This steadiness indicates that hybrid work is becoming an established norm in the industry.
● Remote Work Continues to Dominate: Despite the rise in in-office work, the blockchain industry remains overwhelmingly remote, with 82% of respondents working fully remotely in 2024. While this marks a 5.8 percentage point decrease from 2023, remote work continues to define the sector’s culture and operations.
The slight uptick in in-office and hybrid arrangements suggests that Return to Office (RTO) trends are beginning to influence the blockchain ecosystem. However, the data underscores that the decentralized ethos of blockchain is reflected in its work culture, with remote work remaining the predominant choice for most organizations.
Across Web2 or ‘traditional tech’, recent surveys indicate that approximately 70-80% of tech workers still prefer remote or hybrid models. Companies like Meta, Google, and Amazon have started enforcing stricter in-office policies, but resistance from employees has tempered the pace of RTO mandates.
Respondents by Gender
Based on the 2024 data, male participants make up 72.6% of the workforce, while female professionals constitute 25.9%. This distribution highlights an ongoing gender gap in the industry.
The rise of Stablecoins in Payroll
Key Findings: Last year we saw 3% of people paid in crypto. This year we’ve seen a 3x jump to 9.6%
In 2024, the percentage of people paid in crypto tripled, jumping from 3% in 2023 to 9.6% this year. This growth underscores a shifting trend toward digital asset-based compensation as well as broader access to stablecoin rails. Among those receiving their salary in crypto, stablecoins dominate as the preferred medium of payment. Stablecoins USDC & USDT are leading the charge with the majority of folks who take their salary in crypto receiving USDC.
Stablecoins Lead the Charge:
● USDC (63%) and USDT (28.6%) collectively account for over 90% of crypto salaries, cementing their status as the go-to choices for payroll stability and liquidity.
● Payroll in non-stablecoin options, such as SOL and ETH, appeal to a smaller subset of recipients.
● Though USDT is the most widely traded stablecoin by volume, USDC takes the cake for how employees want to receive compensation. We initially thought this was due to our survey skewing more western. After digging in further, we found it very interesting that none of the major payroll providers in the space (Deel, Remote, Rippling) offer USDT for payroll.
The dominance of stablecoins in crypto payroll aligns with the broader industry narrative of stablecoins as a driving force. This data serves as further validation of Mason Nystrom and Ryan Barney’s assertion that stablecoins are emerging as the next trillion dollar opportunity. Their ability to bridge traditional finance and blockchain ecosystems makes them an increasingly critical component of the crypto economy – not just for institutional use but for retail as well. As the stablecoin space broadens access from innovation and regulatory clarity, it’s possible that we’ll see a larger number of businesses adopt stablecoins for payroll purposes.
Continued Education in Blockchain
Education Levels and Salaries in Blockchain
This year we looked into education backgrounds of the industry and came upon some rather interesting results. An analysis of education levels among blockchain professionals reveals intriguing trends regarding the financial return on continued education:
● Education Beyond a Bachelor’s Degree May Not Pay Off:
-
-
-
○ On average, professionals with a Master’s or Doctorate degree earn less than their peers with a Bachelor’s degree.
-
-
○ Average salary declines from $286,039 (Bachelor’s) to $214,359 (Master’s) and $226,858 (Doctorate).
● Median Salaries Reflect Similar Trends:
○ The median salary for those with a Bachelor’s degree is $150,000, compared to $148,500 for a Master’s degree. This suggests that additional education may not provide a meaningful salary boost within the blockchain industry.
● Specialized Degrees Don’t Guarantee Higher Pay:
-
-
-
○ While doctorate holders have the highest median salary ($200,000), they represent a small sample size. For many roles, industry experience and technical skills may outweigh formal education credentials.
-
-
For professionals entering the blockchain industry, a Bachelor’s degree provides the most significant financial benefit. Continued education, such as pursuing an MBA or advanced degree, does not appear to yield higher salaries on average, emphasizing the industry’s focus on skills, experience, and hands-on expertise over academic credentials. Though we would caveat that there are certain roles where continued education would still shine such as Research and Cryptography.
In most traditional industries, higher education levels typically lead to clear salary increments. For example, moving from a bachelor’s to a master’s degree often results in about a 20% salary increase, while advancing from a master’s to a doctorate can provide an additional 15% boost.
However, in the blockchain sector, the focus is more on practical skills and hands-on experience than on formal educational credentials. Skilled self-taught developers and individuals with non-traditional backgrounds can still command competitive salaries if they demonstrate the necessary expertise. This emphasis on skills over formal education stands in contrast to other industries: in 2022, the median earnings of those with a master’s or higher degree were 20% higher than the earnings of those with a bachelor’s degree.
Compensation
Executive & Founder Compensation
For executive roles, salaries increase as companies mature. At the Seed stage, the average base salary is $146,579, with a median of $120,000. As companies move into Series A, salaries rise, with an average of $201,735 and a median of $200,000. In Series B, the average salary increases to $211,967, with the median reaching $225,000. By the Series C+ stage, executive compensation sees a significant jump, with an average of $274,427 and a median of $293,204, reflecting the higher financial stability and growth of later-stage companies.
Engineering
Engineering Salaries See Significant Growth, Especially for Early and Mid-Career Roles. Engineering salaries have risen across all seniority levels, with the most significant increases in Early Career and Mid-Level roles. Early Career Engineers saw the largest jump, with median salaries rising 25.6% from $110,000 in 2023 to $148,021 in 2024, reflecting strong demand for junior talent. Mid-Level Engineers also experienced notable growth, increasing 14.5% to $176,000, while Senior Engineers saw a more modest 4.9% rise to $202,500, suggesting salary growth stabilizes at higher levels.
Compensation also varies by company stage, with later-stage startups generally paying more. Seed-stage companies offer a median salary of $155,000, while Series A salaries are slightly lower at $147,969, though with a higher average of $152,579, indicating a wider range in pay. Series B companies lead in compensation, with a median salary of $198,000 and an average of $201,436, reflecting their stronger financial position.
Overall, early-career engineers are seeing the fastest salary growth, mid-level roles continue to be a strong investment for companies, and senior engineers command high pay but with slower increases. Later-stage startups tend to offer the most competitive salaries, but early-stage companies usually compensate with stronger equity/token packages.
Product
Early career product managers earn a median base salary of $115,000, mid-level managers earn $151,700, and senior product managers earn $192,500.
In terms of company stage, salaries rise as companies progress. Seed-stage companies offer a median salary of $167,000, with Series A and B offering slightly higher salaries of $170,000 and $170,500, respectively. At the Series C+ stage, salaries reach $200,000, reflecting the stability and growth of more mature companies.
Go to Market (GTM)
Marketing, Sales, Business Development
Early career go-to-market roles command an average base salary of $102,500, with a median of $114,996. Mid-level positions see an average of $145,336 and a median of $140,008. Senior-level roles offer an average of $187,188, while the median climbs to $200,000. This tiered progression reflects the increasing experience and responsibilities associated with higher-level go-to-market positions.
Marketing
In terms of career level, junior marketers have a median base salary of $70,000, with an average of $78,133. Mid-level professionals see a median of $123,500 and an average of $127,167, while senior marketing roles command a median of $191,000 and an average of $185,147.
Looking at company stages, seed-stage organizations offer a median salary of $145,000, while Series A salaries drop slightly to $120,000. At Series B, the median is $142,008, and it rebounds to $145,000 at Series C. Salaries continue to rise beyond Series C, with Series C+ at $155,000 and Series D+ at $185,000. Across all stages combined, the median salary stands at $140,000, with an overall average of $145,725.
Business Development
Business development roles show a notable increase in base salaries both by company stage and by career level. At the seed stage, the median base salary is $40,000, rising to $150,000 at Series A, $168,000 at Series B, and $223,533 at Series C. From a career progression standpoint, junior-level professionals earn a median of $114,996, mid-level roles command $150,000, and senior-level positions reach $160,000.
Finance & Accounting
In 2024, junior-level finance and accounting roles offer an average salary of $106,500 and a median of $97,500. Mid-level positions have an average of $137,500 and a median of $135,000, while senior roles reach an average of $256,020 and a median of $250,000. These figures demonstrate a clear progression in compensation as professionals advance in experience and responsibility.
Operations
Early career operations professionals earn a median base salary of $92,500, mid-level employees earn $121,000, and senior employees earn $195,000. This progression aligns with the expected salary increase tied to experience and responsibility.
In terms of company stage, base salaries rise as companies mature. Seed-stage companies offer $146,000, Series A offers $165,000, and Series B provides $157,500. At the Series C stage, salaries jump to $245,000.
Legal
For legal roles, compensation tends to increase as companies progress through funding stages. At the Series A level, the median base salary is $178,750, rising to $199,500 by Series B. By the time an organization reaches Series C, legal professionals can expect a significant jump to $305,000. These figures illustrate how compensation for legal roles scales in tandem with a company’s growth and maturity.
Token Incentives
The vast majority of token vesting schedules extend over four years, with 64.3% in 2023 and rising to 87.85% in 2024. By contrast, shorter vesting periods (one, two, or three years) comprise a much smaller share of the market. In 2023, they range between 1.80% and 24.60%, and in 2024 they vary from 1.72% to 6.58%. This data suggests a clear preference for longer vesting schedules, particularly moving into 2024.
Median equity grants vary significantly depending on the sector. DeFi projects offer the lowest median at $10,000, while CeFi stands at $28,075 and Gaming at $20,000. Consumer-focused initiatives see a median of $70,000, with Infrastructure at $80,000. Topping the range, NFT-focused organizations offer a notably high median equity package of $250,000.
Gender Pay in Crypto
On average, women make slightly more than men in crypto, with the exception of executive roles. By the median, women make more in Marketing, Operations, BD – but not in Engineering and Executive positions
Our research Engineer Ally Zach took a look and had this to say:
“The median salary for U.S.-based full-time female employees in crypto is approximately 14% higher than that of their male counterparts, though several factors may contribute to this discrepancy. Women in the industry tend to have more years of overall work experience, which could explain part of the salary difference. Additionally, while not statistically significant, women are more frequently found in administrative and operational roles, which generally offer lower base salaries compared to technical and non-executive positions. However, women may also be overrepresented in well-paying upper-management roles, which can initially lead to higher base salaries. Over time, though, their male counterparts may earn more due to greater exposure to equity or token-based compensation, which tends to have higher upside potential. Men in crypto negotiate more aggressively for equity or token compensation, often resulting in lower base salaries but the potential for greater long-term earnings. That said, the variability in additional compensation data makes it difficult to draw definitive conclusions on total earnings across genders.”
Conclusion
Our platform mandate is to support the success of our portfolio companies and the overall crypto ecosystem. In doing this, we have identified that there is no sufficient database for salary/compensation data for our ecosystem and we hope this survey is the first step in providing transparency to crypto compensation.
We believe in the ‘karmic power’ that the blockchain industry embodies. In keeping with this spirit, we will be sharing our anonymized dataset with all of those who participated. We believe that, in providing access to such data, the industry will make better hiring and compensation decisions, and in turn, lead to greater success for all.
We will continue to release our compensation data to participants every year, so if you did not participate, please feel free to do so here.
A number of our portfolio companies are currently hiring. If you or a colleague are interested in breaking into crypto, blockchain, Web3, DeFi, or other verticals in which we invest, check out some of the positions our portfolio companies are hiring for.
Comment below and let us know what you would like to see in our next survey.
The Pantera Team
Special Thanks
As with all these surveys, it truly takes a village. A big thank you to everyone who participated and contributed to making this survey possible.
Special thanks to Franklin Bi, Ally Zach, Jonathan Gieg, Andrew Harris, Mehaa Amirthalingam, ****and Ping Chen for their invaluable input and support. Your insights and efforts helped bring this project to life and have hopefully provided meaningful value to the blockchain ecosystem.