Getting the Pricing Right in Crypto
August 8, 2024 | Matt Stephenson, PhD, and Ally Zach
In 2011, J.C. Penney introduced a new “Fair and Square” pricing strategy, eliminating sales and coupons in favor of everyday low prices. This drastic change confused and alienated loyal customers accustomed to frequent promotions and discounts, leading to a sharp decline in store traffic and sales. As financial difficulties mounted, J.C. Penney was forced to revert to its previous pricing model. This misstep resulted in a significant loss of consumer confidence and contributed to the company’s prolonged struggles.
This example underscores the importance of understanding demand elasticity when making pricing decisions. Pantera Research Lab is aiming to enhance pricing research in crypto to avoid scenarios like J.C. Penney’s missteps. Unfortunately, demand elasticity is hard to measure because prices fluctuate due to both demand and supply changes, making it challenging to discern which factor is influencing the other. Instead, we look for natural experiments where price changes are sudden and unexpected. If the supply side changes suddenly while demand remains constant, we can be confident that the resulting price movement reveals something about demand.
What natural experiments like this might exist in crypto? Pantera Research Lab recently examined three separate scenarios:
- – Arbitrum & EIP-4844
– Base & Memecoin Mania
– Optimism & the Delta Upgrade
Case 1: Arbitrum & EIP-4844
To estimate demand elasticity on Arbitrum, we used a 2-stage least squares regression with L1 gas fees as the instrument variable. This method isolates the variation in Arbitrum gas fees imposed from outside the system, treating L1 gas fees as price shocks. Since these fees are passed through to L2 users, they serve as a natural experiment to measure demand elasticity.
Our regression analysis showed that before EIP-4844, Arbitrum users exhibited a price elasticity of demand of -1.11. This means for every 1 unit increase in gas fees, demand decreased by 1.11 units, indicating that users were approximately “unit elastic.”

The implementation of EIP-4844 then reduced gas fees for L2s by a factor of 10-100x, but user demand didn’t respond linearly to this reduction. We tested whether EIP-4844 represented a structural break in user elasticity, and it did. This suggests that while we had a good natural experiment for pre-4844 elasticity, the results may not fully apply post-4844. Therefore, our initial estimate is best considered a lower bound on elasticity rather than a precise figure.
Good empirical analysis often means adapting to new data, and in this case, acknowledging that significant changes like EIP-4844 can alter fundamental dynamics. Our follow-up work supports this, showing changes in user elasticity post-4844.
Case 2: Base & the March Memecoin Mania
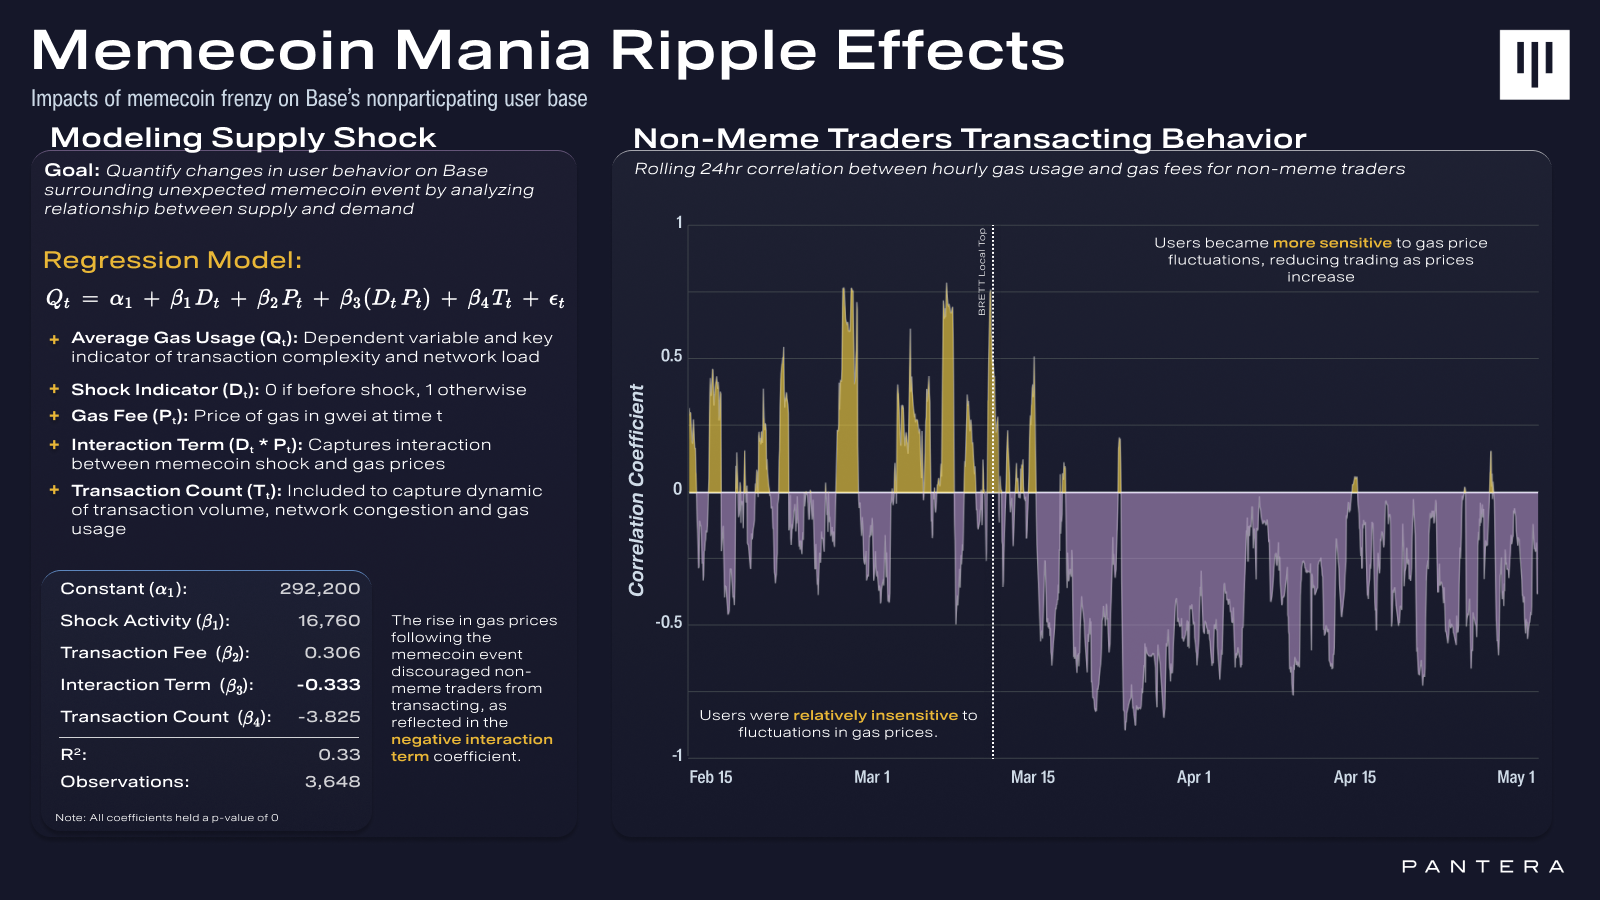
In March, Base experienced its first wave of a memecoin trading frenzy, arguably led by the early performance of a single token. The influx of new meme traders created a network congestion event, driving gas prices to levels not seen since before the EIP-4844 upgrade.

This surge in activity was effectively a negative supply shock for the original Base users, who suddenly found their chain congested and transactions becoming increasingly expensive. Following this shock, these original users became more sensitive to fee fluctuations.
Case 3: Optimism’s Delta Upgrade
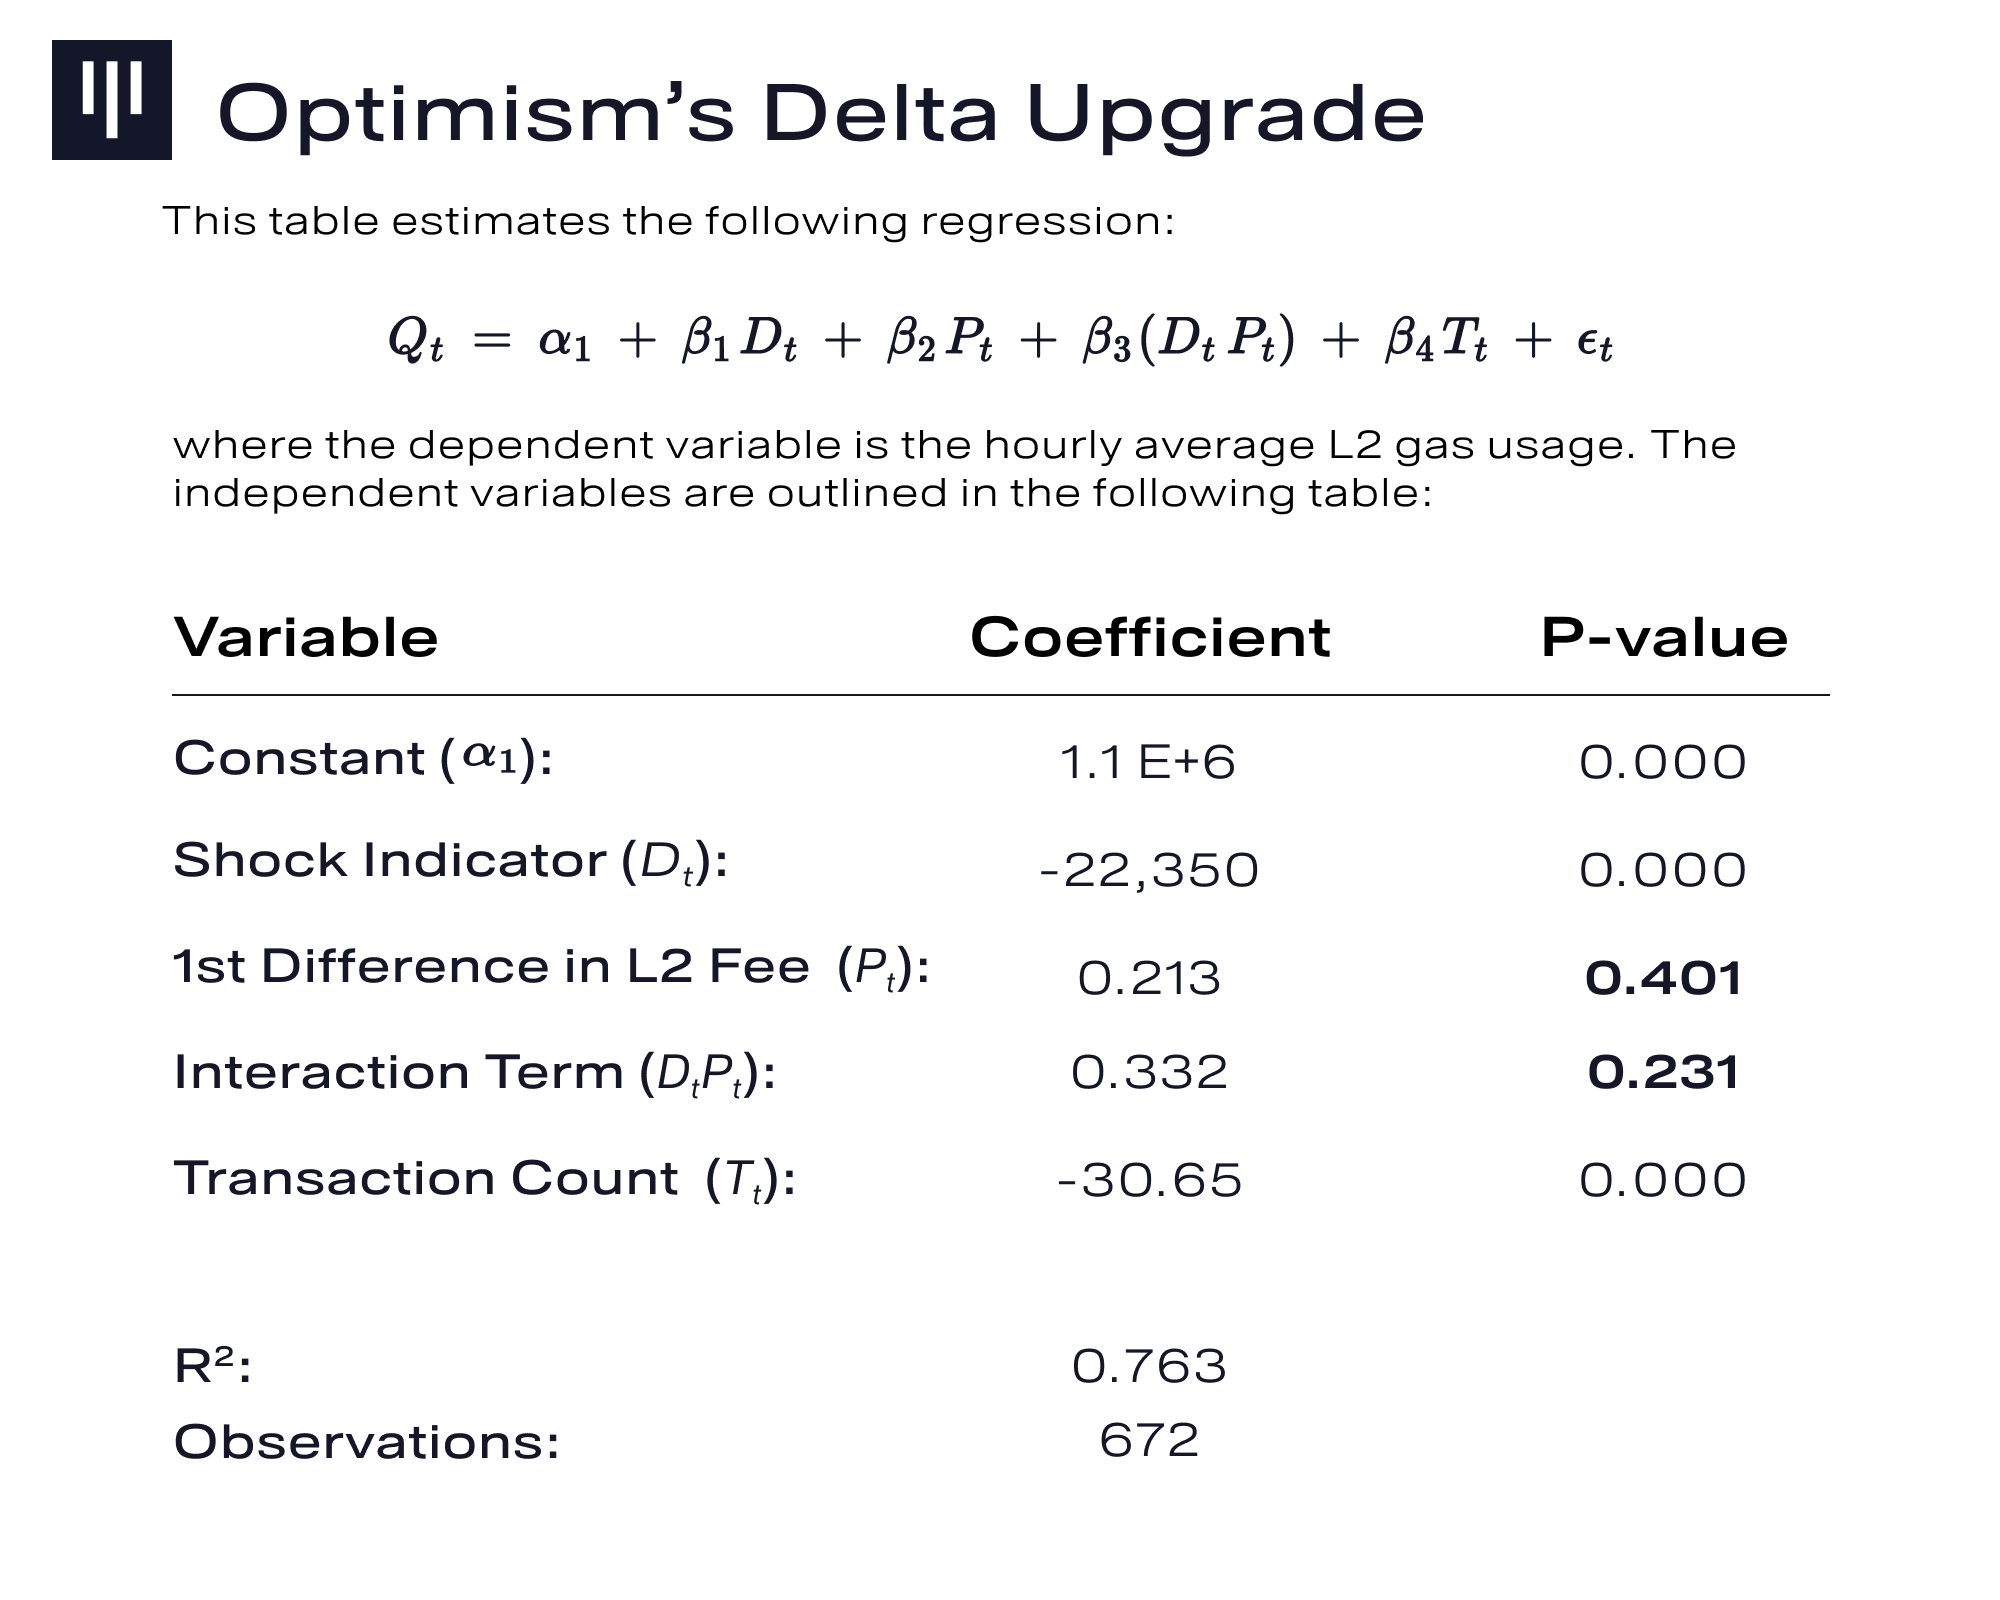
On February 22nd, the Delta upgrade went live on Optimism, improving computational efficiency by approximately 9%. This upgrade was expected to be a positive supply shock, but surprisingly, it led to a significant reduction in gas usage. Typically, when prices are lowered or quality is improved, one would expect an increase in demand.

There may be questions about the impact of Optimism’s 1559 fee structure and whether it indicates a unit root process in the data. Indeed, it does. Stationarity was induced and confirmed by an ADF test, and the results remained consistent. Despite this well-designed study, the outcome remains somewhat puzzling, possibly due to an unknown technical detail within Optimism or demand substitution in anticipation of the 4844 upgrade.
Surface-level metrics, such as transaction count, can highlight outlier behavior and user responses on networks. However, as illustrated by our analysis, deeper analytical methods are essential to accurately assess measurable impacts and infer a potential price elasticity of demand.